Posts

Failure Modes Effects Analysis - FMEA - Step One - throwing down failures.

Image
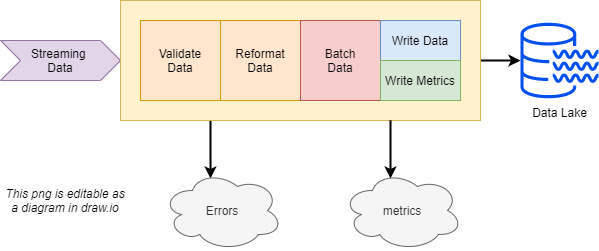
We can make it better if we measure or analyze it. Let's analyze a small program to determine where it might fail and what we can do about it.  We will break down a software program into smaller modules and look at how each phase or component might fail.  We will also look for silent failures or a lack of success metrics where something didn't occur at a time when there should have been some activity. Sample System Under Analysis Our example system is a data lake sink that  Reads streaming data  Validates the data Bundles the data into micro-batch sets Writes the data to a data lake.  Each lake write has a corresponding metrics push that updates our metrics store, statistics and other features. Video Walkthrough In this video, we throw down as many failures as we can think of. We can worry about detection and remediation in a later phase Worksheet Template We will reco...

Capture Multi-Cam videos using both cameras simultaneously on an iPhone

Image
I've wanted to record with both cameras while doing a walkthrough or doing video interviews or other purposes but had no idea how to do it. It turns out it is super easy now that Apple added support for multi-cam recording to their more recent iPhones. I used DoubleTake for this video on my iPhone SE to make this video Other programs claim to require X, 11 or, 12 derivatives. DoubleTake supports the Phone SE 2 which has similar CPU power. Multi-cam recording feels like a great tool for Vlogging, interviews or, other purposes. Video Video recorded on an iPhone SE One App I used DoubleTake because it explicitly said it supported the iPhone SE Capture Modes The application saves the recording in .mov files.  I renamed them to .mp4 files and they loaded without issues in my editor. Discrete Each camera recording is saved to its' own track. The sound is recorded into both video tracks. Editing software can manipulate the two video feeds separat...

Create a portable storable green screen with an inexpensive mobile wardrobe

Image
I wanted to use a green cloth as a video backdrop for video calls and videos. This stand is actually a portable wardrobe rack like the ones you buy when you live in an apartment with no closets. It makes a decent green screen stand with a couple minor additions. This rack looks like https://www.target.com/p/adjustable-single-rod-garment-rack-black-room-essentials-8482/-/A-51688630 The product description says 64" high which is 5'4". That is shorter than I guessed in the video. I added a couple pipe extensions to make it wider and a couple clothespins to temporarily fasten the cloth. Video Description Video created on an iPhone SE with DoubleTake https://apps.apple.com/app/doubletake-by-filmic-pro/id1478041592# Note: Camtasia and other software can remove the green background so you can stand "in front of" anything you wish to show wall talking.

Graph Schema Fun with a Customer and Card Example

Image
Graph Databases have a different paradigm than traditional relational databases. They have two major first-class entities, the Node , and the Edge .  Nodes are entities or things. Edges are relationships that can be typed  and have properties.   The video does a quick demonstration of how we can model a person and sales transactions using  Nodes  and Edges. It shows how there can be multiple Relation Types  between the same two Node Types and other interesting effects that can be done with graph models. Video Walk Through Diagram

Graphs for people and transactions with an eye to fraud

Image
Graph databases seem to lend themselves to modeling people and their interactions and relationships. You tend to see them used in Customer 360 type systems. Let's walk through how a Graph Database might be applied to identifying coupling between fraud incidents. Video A person and their transactions This is an incomplete model for discussion purposes Overlapping people and transactions Coalescing People 

Driving Schema Ownership and Organization

Image
The internet age and cloud competing moved data size, ownership, and privacy to an entirely new level. This is driving organizations to re-thinking where data is moved, how it is transformed, who can see it and, who owns it.   Let's talk about how data moves from producer systems through data pipelines and, into Consumable locations with correct access controls. Target State We want to create a well-organized data ecosystem that makes information available to data consumers. The resulting data should be organized for consumers and made available in a way that works with consumer tools. Data starts in source systems owned by applications and organized for the data producer's use cases. The data is extracted from the producer systems in a raw form and stored in a data ingestion zone or data lake. This stage represents the end of the Producer's involvement. The data is converted from producer oriented models to consumption independent models. Traditionally this has been a stan...

Moving Graph data to a Rectangular Analytical Store

Image
Graph style databases can be used to model some data sets in a more intuitive fashion. This lets us leverage the structure for special purpose applications and data exploration.  Standard analytics tools often work best against relational record-oriented data.  There are a couple strategies for moving graph modeled data to relational stores for analytics. We will walk through some very basic options. There are more sophisticated approaches than what we will discuss Video - YouTube The Initial Graph DB Here we have a simple graph modeling a person with their various addresses and phone numbers.  We have modeled two different address types, mailing, and billing.  The model supports multiple phone numbers but does not break them out by type and purpose. Each of the graph node types can have additional business and technical properties.  The Person  might have FirstName , LastName, last modified at. The relationships  or edges  can also have additiona...

My Wi-Fi is slow. Is it really the Wi-Fi?

Image
How do your devices connect to the Internet?  How does that connection get to the information super-highway? The only way to know is to have some general understanding of how a connected device gets to the remote web site or service. ISP service levels are sold at performance levels, bits per second.  That does not guarantee you that level of performance from your mobile devices all the way to your internet services. Your network configuration combined with your neighbors and your ISP configuration can have a real impact on your effective throughput. People often say their wi-fi is slow when they talk about their internet experience.  Do they really mean it is wi-fi or the internet or somewhere in between?   We talked to someone in a beach neighborhood during the summer and they complained that their wi-fi was Slow .  They then said that a lot of neighbors had wi-fi problems.  These were single-family homes far enough apart that wi-fi may not...

10-10-10 and other techniques for aligning goals during a pandemic

Image
Regular structured communication between workers and their closest management can motivate people, help them overcome obstacles, and create tighter tracking between goals and what people are actually executing on. Regular communication is important during a pandemic or when more people are telecommuting.   Try the 10:10:10 and other techniques to create regular 1-1 communication between managers and those that report to them. These tools work at all levels of an organization. Video Talk References and Links https://toggl.com/blog/one-on-one-how-to-manage-up https://www.payscale.com/career-news/2015/12/productive-one-on-one-meetings https://www.inc.com/tomasz-tunguz/structuring-one-on-ones-to-maximize-your-team-s-success.html ...

You can always make use of more date and time information in modern systems

Image
Capture as much temporal information as you can in today's Information Systems.  Storage is cheap and there always seems to be a need to understand just a bit more about what happened and when it happened.   Make sure you do not lose time data when streaming data into aggregating stores or other down-stream systems. Add event and activity information at every stage and as part of every process.  Video This talk walks through different areas that you may wish to think about. Talk Notes <not yet captured>