Posts

Showing posts with the label Java

Use Amazon Coretto for OpenJDK Java 8 for Debian Linux like Kali - other version too

Image
Linux package repositories often only hold the latest LTS versions.  You have to look elsewhere if you need something like Java 8.  Look to Amazon Coretto if you want specific versions of Java installed on your Linux instance.  Amazon maintains Corretto distributions going back to Java 8 when checked at 2023 06. Debian, Ubuntu, Kali, etc. Users can add the Corretto repository to their instances and then install specific OpenJDK versions using standard apt . Installation Partially derived from https://docs.aws.amazon.com/corretto/latest/corretto-8-ug/generic-linux-install.html The Corretto install instructions assume you have add-apt-repository  installed.  So install add-apt-repository sudo apt update sudo apt install software - properties - common Add the Corretto repository wget - O - https: // apt.corretto.aws / corretto.key | sudo apt - key add - sudo add-apt - repository 'deb https://apt.corretto.aws stable main' Install Java 8 Corretto sudo apt - get up...

Java 8 development on Linux/WSL with Visual Studio Code on Windows 10

Image
Linux on Windows via WSL 2, has become a great development environment when targeting cloud containers and functions.  Windows has a shot at becoming the favorite desktop for users building Linux applications. Visual Studio Code (VSCode) is a great IDE. VSCode can run in a split GUI/Server fashion with the GUI in Windows and all the full SDLC executing on Linux. Development happens inside the Linux, WSL2 leveraging VS Code Server The GUI happens as a real part of the Windows Desktop and connects to Remote  VSCode servers, in this case in WSL Linux Ooh A Video Java Development VSCode's Java integration is built on top of Java 11.  This means you probably will end up with Java 11 JDK installed in WSL2 Linux and in Windows.  By default, applications will be Compiled with Java 11.   You can target  application compilation against versions other than the one used by the IDE. This is done by installing the needed Java versions on the Linux side and adding th...

Routing Java Logs and Business Events to Kafka - via logging

Image
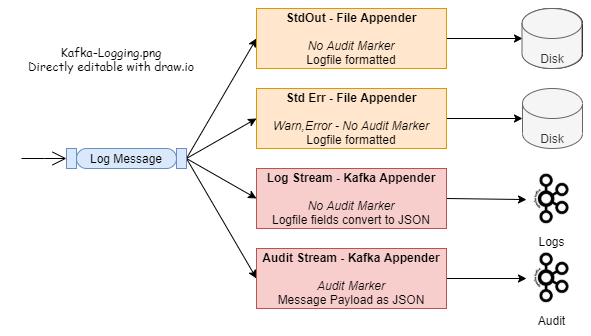
We often want to stream business events or raw logs from our applications to an analytical or operational data stores.  Kafka is currently one of the streaming APIs/platforms of choice for this.   Java applications can use their standard logging APIs and send the logs to Kafka via the Kafka Appender that can be attached to the log4j2 subsystem. We can make just a few tweaks to this and use the same logging mechanisms and Kafka platform to capture custom Business Events. Example code is availabe  https://github.com/freemansoft/spring-boot-log-to-kafka-example , It builds on previous work.   The sample code demonstrates using the logging subsystem to route logs and Audit to different destinations based on their severity or associated tags. The example send logs to the console and to a Kafka logs topics.  It sends tagged log messages to the Kafka Audit . topic.  All of this happens with the application code only ...

Docker on Azure PaaS - Tika Parser

Image
Azure PaaS services are an example of how the cloud has raised the raised the bar in the commodity platform space. More functionality is baked into the platform and less has to be built by software developers and enterprises. Some of the PaaS tenants are that it should be simple to scale-up and scale-out.  Networking should be simple and port exposure should be simple. Microsoft has at least 3 different Container services with different levels of PaaS-ness. They appear to be targeted more at Enterprise customers than the original SMB oriented PaaS services. It may be that the original ones just didn't support enterprise security, networking and other needs. Tech Comments The demonstration deploys a Tika Parser, Java Docker container running on each Azure Linux Docker PaaS services. Microsoft's move towards explicitly containerized PaaS services has both improved and degraded this model. Sample Scripts Use these scripts to experiment with Java Linux deployments on Azure ...

Validate your Spring yml properties files with a unit test in your CI build

Protect yourself! Validate yaml configuration file for syntax errors  before deploying your application.  Don't wait until you fail a deployment to recognize simple copy/paste errors and typos. Unit Test Code Create JUnit tests that run as part of every build. GitHub Find the  source code on GitHub in freemanSoft/ValidateSpringYml .  Source Code The following code validates application.yml.  You can pass in any file name or the wildcard "*" The previous Unit Test exercises the following utility method.  This method can validate all files that match the passed in pattern where  "*" means all yml files. Find the  source code on GitHub in  freemanSoft/ValidateSpringYml .  Original Post 2017 Oct 3

Maven Lifecycle Phases - Fitting in Code Analysis and Other Tools

Image
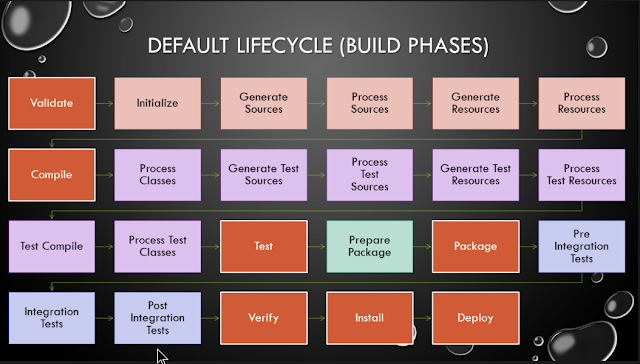
The build management portion of Maven operates on a type of Template Pattern. Maven moves from lifecycle-phase to lifecycle-phase until there a step failure or until all steps are complete. The following diagram lists the build lifecycle phases. The orange squares represent the main targets that people run. Every phase is executed starting with Validate until the requested end phase is reached. For example "mvn validate"  runs just the Validate  phase. " mvn compile" runs Validate, Initialize, Generate Sources, Process Sources, Generate Resources, Process Resources and Compile. Each Maven Plugin  executes with in a phase. The Surefire  unit test plugin, as an example, typically runs the tests in the Test  phase.  This means that unit tests don't run if Validation, Compilation, class processing or any of the other preceding phases run with errors. Maven plugins can execute in their default phase or in any phase of your choosing.  Lifecy...

Enabling Microsoft Application Insights for Mule ESB monitoring

Image
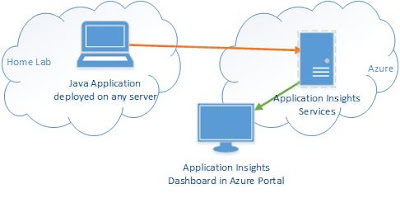
Microsoft Azure Application Insights requires Mule 3.7 or later. Application Insights depends on org.apache httpclient and httpcore versions that are first bundled with Mule 3.7 Application Insights is an Azure based application performance dashboard that can monitor applications deployed inside, or outside, Azure.  Application Insights SDKs are available for a variety of languages with a heavy focus on standard library web driven applications or services. This blog entry describes how easy it is to enable Application Insights for a Mule ESB application that does not use any of the out-of-the-box supported web hooks. In this case, we monitoring the out-of-the-box JMX beans provided by Mule. Performance information is gathered by Application Insights where it is displayed in the Azure Portal. Mule exposes performance data about applications and flows via JMX.  Any of this can be forwarded to the Application Insights Dashboard. Steps Create an Application Insights...

Enabling Microsoft Application Insights for JMX monitoring of a Spring wired Java application

Image
Application Insights is an Azure based application performance dashboard that can monitor applications deployed inside, or outside, Azure.  Application Insights SDKs are available for a variety of languages with a heavy focus on standard library web driven applications or services. This blog entry describes how easy it is to enable Application Insights for a Spring wired Java application that does not use any of the out-of-the-box supported web hooks. In this case, we are enabling Java / JMX monitoring of a custom Spring application running in my home lab. Performance information is gathered by Application Insights where it is displayed in the Azure Portal. I did this work as part of building a message driven application that had no true web interface. The application runs in a container that does not support tomcat or web filters normally used to enable Application Insight. Microsoft does a good job of describing how to monitor Java Tomcat, Struts, Spring MVC and other sta...

Using files with embedded Mule Expression Language for better looking HTML

Image
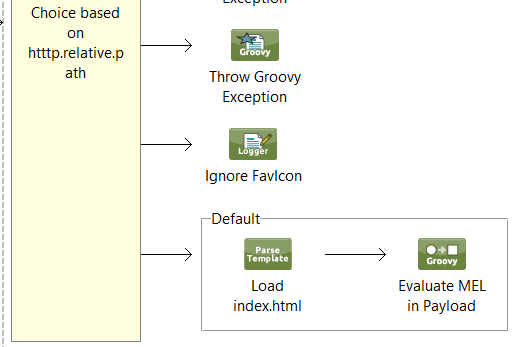
Our team returns a HTML home page  when anyone makes a GET request at the root of our API or monitoring web endpoints.  This  service help page includes a combination of static and dynamic content. We struggled building decent looking pages until we started using the Mule Parse Template  component and groovy component that invokes the Mule Expression Language (MEL) processor against the markup. The example to the right shows how our  default  behavior in a our web choice router processes a web template. Sample Code You can find sample code in the Coda Hale exception metrics counter demo on GitHub Parse Template The Parse Template  component loads a file into the Mule payload. You can use this to return any raw file to the caller based on the request path. This lets you return html, css or js type files from iniside your application.  We will use this feature to load an HTML file into the payload that includes embedded MEL.  The...

Capture and expose system exception statistics in Mule using Coda Hale Metrics

Image
This article describes how to use the Coda Hale metrics library to capture the counts and types of system exceptions thrown outside of Mule ESB flow processing.  Historical exception information is exposed via JMX or written to disk using CodaHale reporters as described on the CodaHale metrics web site . You can use this same technique in any Java application.  We inject instrumentation at the system context level.  That component converts the wrapped exception stack to a counter name that is then created and incremented in the Coda Hale registry.  I use the simple running counter because I don't find the native Coda Hale histogram data useful for this type of metric. You can use other metric types if you want more complex statistics. Components We use 2 injection components 2 codahale components and a custom listener  to make this work: MetricsRegistry:  A CodaHale singleton that maintains a reference to all statistics. It is injecte...

Capture and expose flow exception statistics in Mule using Coda Hale metrics

Image
This article describes how to use the Coda Hale metrics library to capture the counts and types of exceptions thrown as part of Mule ESB flow processing.  Historical exception information is exposed via JMX or written to disk using CodaHale reporters as described on the CodaHale metrics web site . You can use this same technique in any Java application.  We add an instrumentation component to each mule Exception Flow.  That component converts the wrapped exception stack to a counter name that is then created and incremented in the Coda Hale registry.  I use the simple running counter because I don't find the native Coda Hale histogram data useful for this type of metric. You can use other metric types if you want more complex statistics. Components We use 1 injection component, 2 codahale components and a custom flow component to make this work: MetricsRegistry:  A CodaHale singleton that maintains a reference to all statistics. It is inject...