Posts

Visualizing Covid Vaccinations - Python data prep and steps

Image
We want to plot the Covid vaccination rates across different countries world-wide or different states in the USA. We need to create a standardized dataset that is accurate enough for our graphing purposes. The folks at Our World in Data (OWiD) gather that information to create composite data sets.  Each independent entity reports data on its own schedule.  The composite  dataset can be missing entire days of data for some entities or individual data attributes in some of the days that are actually reported.   Lets look at the steps required to create reasonable comparisons and progress graphics. Source Data and Code Dataset courtesy of  Our World in Data : GitHub Repository Python code and scripts described here are available  on GitHub Videos  links at the bottom of this article Data Consistency We want time-series data that lets us exactly line up the data for each reporter. This table shows two different countries, C1 and C2.  They each r...

Monitor Internet Broadband service with a Raspberry Pi 4 and some Python

Image
You can easily automate capturing broadband connection statistics with some Python code  running on a Raspberry Pi, a Mac or, a PC.  I used a Raspberry Pi 4 as my test appliance because it is cheap and can support 1GB/s ethernet connections. That means it is fast enough to service most residential or low-end commercial connections. I'm lazy and wanted the data to end up in a secure public cloud that could be populated and viewed from anywhere.  We can send our broadband statistics from 1 or more locations and graph the different locations against each other. Any tool could be used. Monitoring One or Compare Two  We wanted to compare two different internet provider's service levels.  One provider is a FIOS 1GB down / 1GB up.  The other is a cable service with 1GB down / 50MB up. The providers and the technology were different.  We wanted to know if the complaints about one of the providers were valid. Relies on Speedtest.net infrastructure We're going t...

Querying Python logs Azure Application Insight

Image
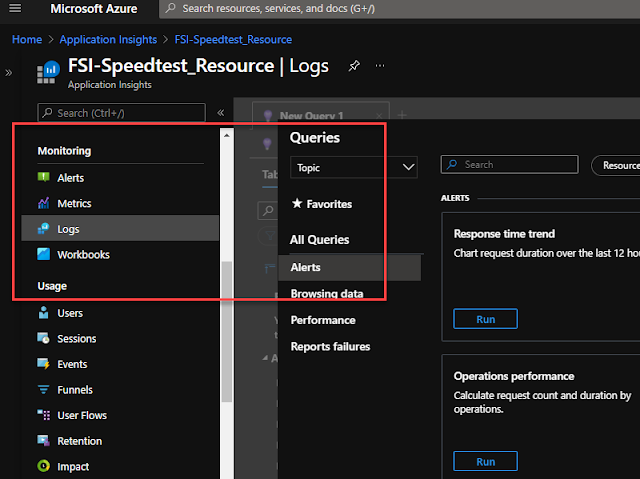
You can send your Python logs to Azure Application Insights from anywhere and then leverage the Application Insights query and dashboard capabilities to do log analysis.  Getting access to the logs is trivial. I wanted to plot basic internet performance information from data generated from two different machines in two different locations.  The source code is on GitHub here  freemansoft/speedtest-app-insights . That project runs speedtest.net measurements and then posts them to Azure Application Insights.  It logs the raw data when the --verbose switch is set.  That verbose output is sent to Azure App Insights. Execution pre-requisites You have an Azure login You have created an Azure Application Insights Application key https://docs.microsoft.com/en-us/azure/azure-monitor/app/create-new-resource You have pushed data to Application Insights.  I used https://github.com/freemansoft/speedtest-app-insights with the _--verbose__ switch Video walkthrou...

Querying Python Metrics as customMetrics and custom attributes as customDimensions in Azure Application Insight

Image
Azure Application Insights can be a collection point for Python Metrics that you can query and filter against.  We can send Open Census metrics from anywhere in the world into Azure Application Insights. This lets us see our program metrics from any browser that can reach the Azure console.  Application Monitor gives us a zero admin performance console. OpenCensus metrics are recorded in Application Insights as customMetrics . Every metric sent is a row in Application Insights. The Azure  OpenCensus Azure Exporter  adds a standard set of attributes that appear in App Insights as CustomDimensions .  We can add additional custom dimensions (attributes) to any metrics record sent Azure Application Insights. All metrics are actually captured in a customMetrics table that we can query against. Execution pre-requisites You have an Azure login You have created an Azure Application Insights Application ...

Displaying Python Metrics in Azure Application Insights

Image
We can capture Python performance metrics in Azure Application Insights. This will let us see our program performance from anywhere that can reach the Azure console.  I've used this to capture a variety of Python data manipulation and process timing without having to stand up any metrics databases or dashboards. I wanted to plot basic internet performance information from data generated from two different machines in two different locations.  The source code is on GitHub here freemansoft/speedtest-app-insights . That project runs speedtest.net measurements and then posts them to Azure Application Insights.  We can create charts for any of the data gathered as part of this process. Target Graphic We want to create a graphical tile that shows our connection ping time broken out per test machine. The program code above posts new ping time data every 5 minutes.  This graphic shows the ping results for the last 4 hours. Execution pre-requisites You have an Azure login You...

Failure Modes Effects Analysis - FMEA - Step Two - Detection and Remediation

Image
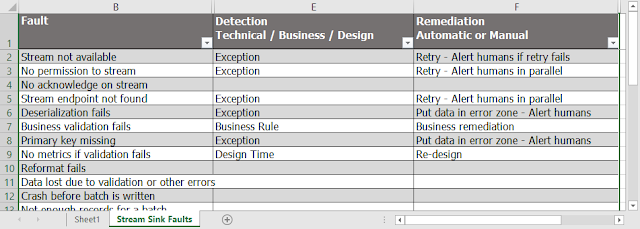
We evaluate the identified possible faults and issues to determine how we can detect the failure and how we can remediate it.    For this discussion, we will bucket the failure modes into three types which can help us determine how they can be detected.   We will categorize failures as technical, design time and business types of failures.  We can use the category to determine how we wish to remediate the failures. Some of the business rule failures will be "by policy" and their remediation will be in the business departments. The other failures will be remediated via technical means. Capturing - Detection and Remediation We want to fill in the  Detection  and  Remediation  columns.  You can tune the meanings of these columns to your use case.  For this walkthrough We sweep across all the faults to determine how the fault would actually be detected and then how we would permanently, tactically, manually, transiently remediate that....

Software Development in a Container - Coding by Copy - a Primer

Image
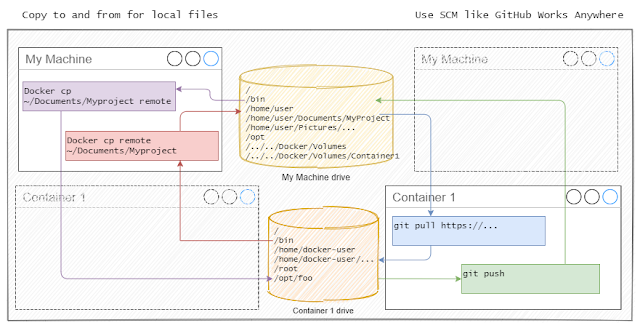
Containers make it easy to set up a complex data scientist development environment.  A developer can just spin up a Python, Jupyter Notebook, Spark, Hadoop, or another type of container on a local machine in minutes. Containers can be confusing when you first work with them. Here we talk a little about how you can get code and data into your container environment and how you can get it back out. I want to write code  local  to my laptop and run the code inside a fully configured Anaconda container. And, I'm lazy. Two ways to get code onto a container for development Containers are standalone  mini machines  with private disk space, CPU, networking  and other services.  They are not intended to retain state, something that we definitely want to do in a development environment. We need to get our code inside the container. We can do the same thing with data or we can have our code pull the data in at runtime. We plan on doing all  development on ...

Software Development in a Container - Mounting code into the container - A Primer

Image
Containers make it easy to set up a complex data scientist development environment.  A developer can just spin up a Python, Jupyter Notebook, Spark, Hadoop, or another type of container on a local machine in minutes. Containers can be confusing when you first work with them. Here we talk a little about how you can get code and data into your container environment and how you can get it back out. I want to write code local to my laptop and run the code inside a fully configured Anaconda container. And, I'm lazy. Two ways to get code onto a container for development Containers are standalone mini machines with private disk space, CPU, networking  and other services.  They are not intended to retain state, something that we definitely want to do in a development environment. We need to get our code inside the container. We can do the same thing with data or we can have our code pull the data in at runtime. There are two primary ways of getting code onto a machine.  We c...

Failure Modes Effects Analysis - FMEA - Step One - throwing down failures.

Image
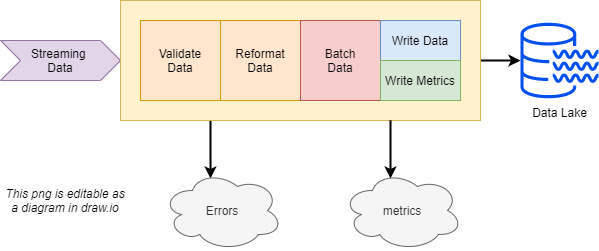
We can make it better if we measure or analyze it. Let's analyze a small program to determine where it might fail and what we can do about it.  We will break down a software program into smaller modules and look at how each phase or component might fail.  We will also look for silent failures or a lack of success metrics where something didn't occur at a time when there should have been some activity. Sample System Under Analysis Our example system is a data lake sink that  Reads streaming data  Validates the data Bundles the data into micro-batch sets Writes the data to a data lake.  Each lake write has a corresponding metrics push that updates our metrics store, statistics and other features. Video Walkthrough In this video, we throw down as many failures as we can think of. We can worry about detection and remediation in a later phase Worksheet Template We will reco...