Posts

What do we want out of load or performance test?

Image
We use performance tests to verify the raw throughput of some subsystems and to verify the overall impact some subsystem has on an entire ecosystem.  Load tests act as documentation for performance indicators and re-enforce performance expectations. They are vital in identifying performance regression. Load and performance tests are an often overlooked part of the software release lifecycle.  Load tests, at their most basic level, are about stress testing a system by dropping a lot of work onto it. Sometimes it is a percentage of expected load, other times it is the expected load, and other times it is future expected levels of load.  A failure to test  expected  near-term load can lead to spectacular public failures. Video Measurements  Your  business requirements  determine requirements for throughput, latency. Your  financial requirements impact the cho...

Creating Features in Python using tumbling windows

Image
This article originally discussed "Sliding Windows" but actually refers to a variant called "Tumbling Windows" The first step to using ML for intrusion analysis detection is the creation of Features that can be used in training and detection.  I write in  another blog  about creating features from tumbling windows bound aggregates of packet streams. Inbound packets are analyzed and then grouped with other packets that happen near each other.  We can walk through the steps of   GitHub repository   contains Python code that creates features from Wireshark/tshark packet streams. The program accepts live tshark output or tshark streams generated from captured .pcap files.  Network Traffic into Tumbling Windows The example program requires Python and Wireshark/tshark.  The Python code uses 4 multiprocess tasks making this essentially a 5 core process.  It is a 100% CPU bound on a 4 core machine so I suspect it ...

Network Intrusion Features via Tumbling Time Windows

Image
This article originally used the term "Sliding Time Window".  This article actually discusses a variant called the "Tumbling Time Window" Feature creation is one of the first steps toward creating Machine Models that apply to network monitoring or other stream-oriented data processes.  We massage independent variables into a form that can be used by ML models or other statistical tools. This often involves transforming source data through numerical conversion, bucketing, aggregation, and other techniques. For this project, we'd like to try and train a machine model to detect intrusion events by having it look at network traffic. People sometimes try and  directly consume events  as inputs. An individual network packet does not contain enough context to be useful on its own. A Tumbling time window makes it possible to create features with more context than you would get with a single message. This GitHub repository contains Pyth...

Visualizing Covid Vaccinations - Python data prep and steps

Image
We want to plot the Covid vaccination rates across different countries world-wide or different states in the USA. We need to create a standardized dataset that is accurate enough for our graphing purposes. The folks at Our World in Data (OWiD) gather that information to create composite data sets.  Each independent entity reports data on its own schedule.  The composite  dataset can be missing entire days of data for some entities or individual data attributes in some of the days that are actually reported.   Lets look at the steps required to create reasonable comparisons and progress graphics. Source Data and Code Dataset courtesy of  Our World in Data : GitHub Repository Python code and scripts described here are available  on GitHub Videos  links at the bottom of this article Data Consistency We want time-series data that lets us exactly line up the data for each reporter. This table shows two different countries, C1 and C2.  They each r...

Monitor Internet Broadband service with a Raspberry Pi 4 and some Python

Image
You can easily automate capturing broadband connection statistics with some Python code  running on a Raspberry Pi, a Mac or, a PC.  I used a Raspberry Pi 4 as my test appliance because it is cheap and can support 1GB/s ethernet connections. That means it is fast enough to service most residential or low-end commercial connections. I'm lazy and wanted the data to end up in a secure public cloud that could be populated and viewed from anywhere.  We can send our broadband statistics from 1 or more locations and graph the different locations against each other. Any tool could be used. Monitoring One or Compare Two  We wanted to compare two different internet provider's service levels.  One provider is a FIOS 1GB down / 1GB up.  The other is a cable service with 1GB down / 50MB up. The providers and the technology were different.  We wanted to know if the complaints about one of the providers were valid. Relies on Speedtest.net infrastructure We're going t...

Querying Python logs Azure Application Insight

Image
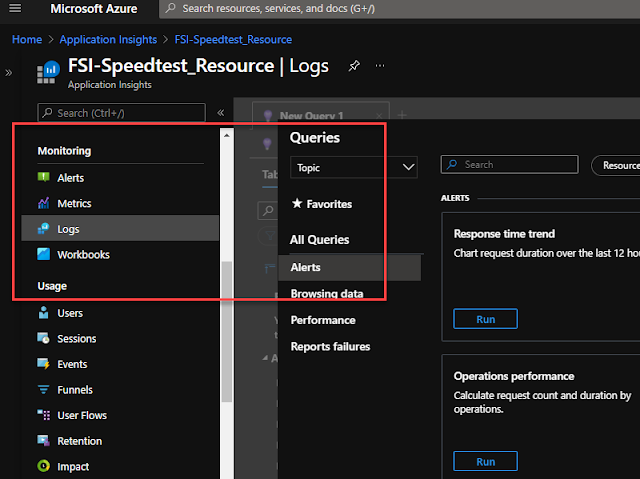
You can send your Python logs to Azure Application Insights from anywhere and then leverage the Application Insights query and dashboard capabilities to do log analysis.  Getting access to the logs is trivial. I wanted to plot basic internet performance information from data generated from two different machines in two different locations.  The source code is on GitHub here  freemansoft/speedtest-app-insights . That project runs speedtest.net measurements and then posts them to Azure Application Insights.  It logs the raw data when the --verbose switch is set.  That verbose output is sent to Azure App Insights. Execution pre-requisites You have an Azure login You have created an Azure Application Insights Application key https://docs.microsoft.com/en-us/azure/azure-monitor/app/create-new-resource You have pushed data to Application Insights.  I used https://github.com/freemansoft/speedtest-app-insights with the _--verbose__ switch Video walkthrou...

Querying Python Metrics as customMetrics and custom attributes as customDimensions in Azure Application Insight

Image
Azure Application Insights can be a collection point for Python Metrics that you can query and filter against.  We can send Open Census metrics from anywhere in the world into Azure Application Insights. This lets us see our program metrics from any browser that can reach the Azure console.  Application Monitor gives us a zero admin performance console. OpenCensus metrics are recorded in Application Insights as customMetrics . Every metric sent is a row in Application Insights. The Azure  OpenCensus Azure Exporter  adds a standard set of attributes that appear in App Insights as CustomDimensions .  We can add additional custom dimensions (attributes) to any metrics record sent Azure Application Insights. All metrics are actually captured in a customMetrics table that we can query against. Execution pre-requisites You have an Azure login You have created an Azure Application Insights Application ...

Displaying Python Metrics in Azure Application Insights

Image
We can capture Python performance metrics in Azure Application Insights. This will let us see our program performance from anywhere that can reach the Azure console.  I've used this to capture a variety of Python data manipulation and process timing without having to stand up any metrics databases or dashboards. I wanted to plot basic internet performance information from data generated from two different machines in two different locations.  The source code is on GitHub here freemansoft/speedtest-app-insights . That project runs speedtest.net measurements and then posts them to Azure Application Insights.  We can create charts for any of the data gathered as part of this process. Target Graphic We want to create a graphical tile that shows our connection ping time broken out per test machine. The program code above posts new ping time data every 5 minutes.  This graphic shows the ping results for the last 4 hours. Execution pre-requisites You have an Azure login You...