Monitoring Windows Server 2012 performance running in a Hyper-V virtual lab
I have a lab environment of 5 machines, one AD/DNS/Manager and 4 Hyper-V virtual machines. I want to be able to monitor the performance of the various hosts under different conditions to see where I've run out of resources.

There are two major components to the monitoring. The first is the performance counters on each monitored machine. These act as the source of performance information. The second is a monitoring console. That console can either be one that displays all information or can be one that displays information only when performance numbers fall outside some criteria.
Select the servers that you want to monitor in the Servers pane of any non-dashboard screen in Server Manager. We see a "Performance counters not started" message in the screen below. We will have to start the counters on each machine we wish to monitor to get any performance information.

The selected servers appear in the Performance pane on the same page. Scroll down to the Performance area on any of the non-dashboard screens. Right mouse on any server where the Counter Status is Off and select Start Performance Counters. Their status should change from "Off" to "On - Waiting for data". Data should show up after some period of time.

Note: I actually had to restart my hyper-v server (the whole virtual lab) before I actually saw any counters gathered.


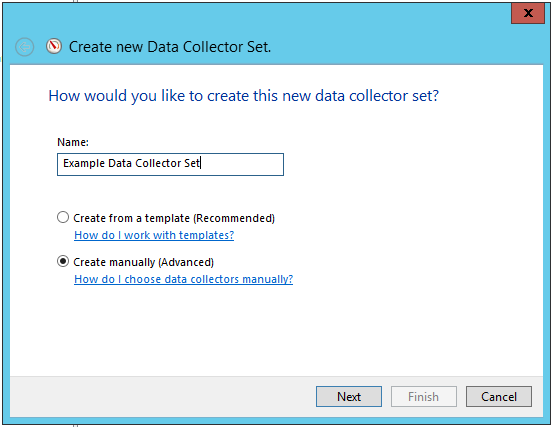 Performance Monitor can collect performance counters from remote machines and store them to a local disk for later analysis. It does this through the Data Collector Sets. You'll want to create a new Data Collector set in Performance Monitor by using the popup menu under Performance--> Data Collector Sets --> User Defined. The "template" collector sets only apply to the local machine. Chose to Create Manually on the first Create new Data Collector Set panel.
 Then pick the data you are interested in on theCreate new Data Collector Set panel. Select Performance Counter. I have System configuration information selected for some other task I was working on when I created the screen-shot.
 You will then be asked which performance counters you wish to collect. Click on the Add... button.

Select the computer from the drop list and then select the metrics you want.
 You can use the Browse... button to find the machine. I just type in the server name and click on Check Names to verify I typed it right. Click OK.
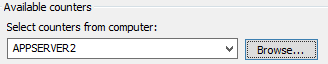 The server name will show up in the computer field without the "\\" in front of it.
 Enter the back slashes in front. You should see the counter list refresh.Selecting monitors without the "\\" in front of the machine name always causes the monitors to get added without a computer name.
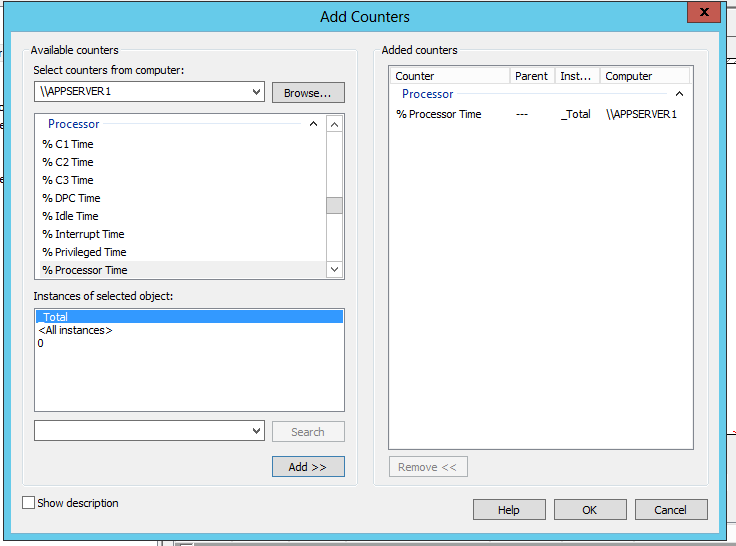
 Select the performance counters you want and add them. They should show up with the appropriate machine names in the Computer column. You can add monitors from as many machines as you want.
This shows the "% Processor Time" counter for three machines including the machine I'm running the Performance Monitor application on.
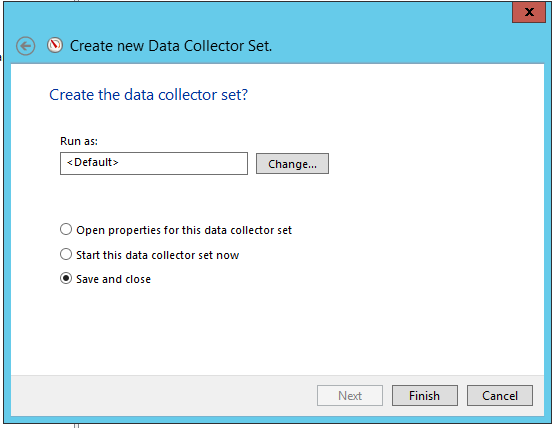 Advance through the modal panels until you find the one that asks who the data set should be "Run as:". You must pick a user to run the collectors under. I'm totally lazy in my private test lap and pick administrator.
This completes setting up the monitors. You can see them listed in the User Defined section of the Data Collection Sets portion of the left hand pane of the Performance Monitor program.

There are two major components to the monitoring. The first is the performance counters on each monitored machine. These act as the source of performance information. The second is a monitoring console. That console can either be one that displays all information or can be one that displays information only when performance numbers fall outside some criteria.
Windows Server Manager Performance View
The Windows Server Manager displays performance information for out-of-bounds situations where the values coming off of a machine are outside of some specified range. Server Manager monitors as many machines as you want from its' All Servers page.Select the servers that you want to monitor in the Servers pane of any non-dashboard screen in Server Manager. We see a "Performance counters not started" message in the screen below. We will have to start the counters on each machine we wish to monitor to get any performance information.

The selected servers appear in the Performance pane on the same page. Scroll down to the Performance area on any of the non-dashboard screens. Right mouse on any server where the Counter Status is Off and select Start Performance Counters. Their status should change from "Off" to "On - Waiting for data". Data should show up after some period of time.

Note: I actually had to restart my hyper-v server (the whole virtual lab) before I actually saw any counters gathered.
Seeing Out of Bounds Conditions
This screen shows any "out of bounds" conditions detected. (It really only supports memory and CPU). The following screen image shows an "alert situation" has occurred on my SERVER2012HOST machine.
Performance Monitor Program (Immediate)
Realtime Remote Counter Collection and Display
The Performance Monitor program can be used to plot mixed sets of performance counters (metrics) from multiple machines in real-time. You can find it via the Server Manager Tools-->Performance Monitor menu item. The Performance Monitor user interface updates selected counters (metrics) on regular intervals.

Data can be gathered as part of a reusable Collector Set for later display or gathered for immediate display in the UI.
Adding Counters to the Performance Monitor
You add performance counters to the display by clicking on the green plus sin in the right hand pane. That will bring up the Add Counters panel. The machine selector "Select counters from computer" defaults to the local machine. Performance counters like resources with multiple units offer the option of all or individual instances. In the case of processors this would be all of the cores or only a select sub-set. Select the desired counter and instances and click on the Add>> button and then OK. The graph will immediately start updating with the newly configured counters.
Troubleshooting the Instances List
Sometimes the Instances list in the lower left will remain empty when a counter is selected in the middle left hand panel. You can usually just select a different counter and then re-select the one you want to get the instances list to refresh.
Adding Counters from a remote machine
You can select or Browse... any of the machines on your network that have enabled remote performance counter collection.
- Click on the Browse... button on the Select Computer panel. Enter the remote server name in the "object name" panel and click Check Names. Click on OK when it reformats the name.
- You will be returned to the Add Counters panel with you the just selected computer name in the drop list. I had to prefix this with \\<server_name> to get this to work.
- Select the metric you want from the Add and wait until the Instances of selected object: is updated. It usually defaults to _Total or All instances.
- Click on the Add>> button to put the new counter in the Added Counters pane on the right hand side
- Click OK.
- The graph should automatically update the same it did with the local example above.

Troubleshooting Stuck "Waiting on Data".
I found that my "Performance" pane never updated for newly added servers. I had to enable a firewall exception on each remote machine so I could gather statistics. Run the following command on each remote machine. I did this by opening up a remote command window using Windows Powershell menu item available when you right mouse on a server in the All Servers view.You should see a message "Updated 4 rule(s)"netsh advfirewall firewall set rule group="Performance Logs and Alerts" new enable=yes
Performance Monitor Program (Ongoing)
The Performance Monitor program can be used to gather information either in an ongoing basis or while profiling or testing some application or configuration. You should remember that the performance counters can use a lot of disk space if left running. The usual order of operations for a test scenario is.
- Start collection on a data set
- Run some test program that generates traffic
- End the collection for that data set
- Open the resulting performance monitor files
Gathering Performance Data from Multiple Hosts
Performance Monitor can collect performance counters from remote machines and store them to a local disk for later analysis. It does this through the Data Collector Sets. You'll want to create a new Data Collector set in Performance Monitor by using the popup menu under Performance--> Data Collector Sets --> User Defined. The "template" collector sets only apply to the local machine. Chose to Create Manually on the first Create new Data Collector Set panel.Select the computer from the drop list and then select the metrics you want.
The server name will show up in the computer field without the "\\" in front of it.This shows the "% Processor Time" counter for three machines including the machine I'm running the Performance Monitor application on.
Advance through the modal panels until you find the one that asks who the data set should be "Run as:". You must pick a user to run the collectors under. I'm totally lazy in my private test lap and pick administrator.This completes setting up the monitors. You can see them listed in the User Defined section of the Data Collection Sets portion of the left hand pane of the Performance Monitor program.
Starting the Data Collection Set
Start data collection by highlighting the collection set and then clicking the green play button (why isn't it a red record circle?) in the upper portion of the screen. Press the black square to stop collection.Viewing the Collected Performance Data.
Find the captured performance information and double click on the Performance Monitor Data file. You can find the location of a Data Collector's captured performance information in the right hand pane of the Performance Monitor program after you've highlighted the appropriate Data Collector Set in the left hand pane.


I also start using good monitoring service which is www.monitive.com which monitors from the end-user's perspective and shows you precisely how your online business performs at the application, transaction, and infrastructure level in real time.
ReplyDelete