Posts

Showing posts from August, 2020

Acceptance Criteria - The True Definition of Done

Image
Let's talk about Acceptance Criteria in User Stories and in Tasks.  Acceptance Criteria are the true Definition of Done for a work item and are the critical component when trying to estimate time.   My experience has been that User Stories or Tasks are often poorly written which creates a misunderstanding of the scope and breadth of a work item.  Adding real Acceptance Criteria drastically changes those conversations for the better. Video Presentation We capture different categories of information when we describe a unit of work. This unit of work is often encapsulated in a User Story  or Task depending our working style, Kanban, Scrum, Lean, etc.   These Story components support different parts of the process. Time Estimation A lot of the Task Definition and specification work exist to support budgeting and time estimation.  The team uses the size estimate to figure out how much time and resources need to be applied. Management wants time estimates for budgeting purposes and as

Every Team is Successful and You still Failed

Image
Decoupling tasks makes it possible for teams to operate in a more agile fashion. It can also create a situation where a project fails even though every team declared success. This often happens because no one is minding the gaps between teams or managing the ordering for dependencies. I'm not suggesting you go to a waterfall style federal PMO.  Instead, create a process for tracking dependencies and a regular cadence for discussing them and working through the issues. Video The video is only 10:00 minutes long so it doesn't solve all problems. It is really just intended as a way of starting a discussion[   Slides These are the slides used in the presentation. Someday I will add speaker's notes :-( Slides not Presented

ML Dev Ops - Not Traditional Software Development

Image
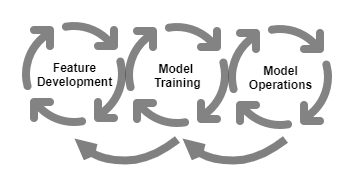
Machine Learning and Machine Models are the latest wave of change in the software development and business rule industry.  We spent the last 20 years continually improving our Software Development Lifecycle resulting in today's Continuous Integration and Continuous Development (CI/CD).  Machine Learning, Build and Train and ML DevOps are just different enough that we need to step back and rethink some of our current standards. Using standard CI/CD hardware and software for ML build and train may not be the right approach. Feature Creation and Model Development  Feature development and Model training are iterative processes with tens or even hundreds of train/analyze cycles. Data scientists need the flexibility to make rapid changes and the compute support to do these iterations in some reasonable amount of time.  Regulators and Model Risk Officers need to to see the data transformations and training data itself  understand why a given model comes up with its results. Notice the bac

Python multiprocessing.Pool improvement examples in Donor's Choice data

Image
We're going to walk through a couple places where simple Python parallelization created big performance improvements using the Elasticsearch Donor's Choice prep scripts on GitHub  .  This is a clone of the Elasticsearch GitHub repository of the same name. My rule of thumb for this particular processing section was that I would only move to parallel execution if execution time was reduced within 80% of the number of extra processors. So with 8 cores I wanted to get at least 6 times performance. Python Multiprocessing Parallel Execution Python is essentially single threaded in many situations.  Thread based parallelization is pretty much only useful for I/O bound situations like web requests where the threads are idle most of the time. Compute bound parallel execution is usually multi-processor with work being fed off to essentially different programs.   No Shared State Each processing unit in multi-processing parallel execution runs in its own address space.  Data must be copied

Visualizing the Donors Choose data set with Kibana and Elasticsearch

Image
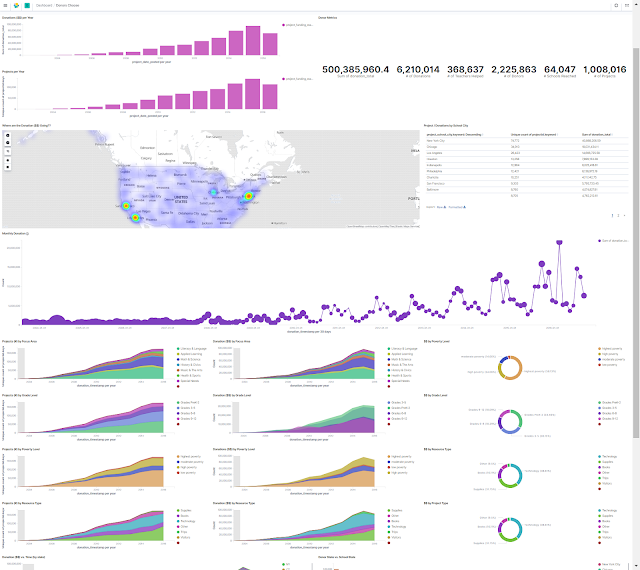
The Elasticsearch example codebase includes a Donors Choose public data set. The example uses a set of Kibana visualizations. The following image shows a subset of the visualizations used in the dashboard.   Donors Choose Kibana Dashboard The map visualization uses provided  geopoint  , Lat and Long, data. You can see there are  6.2 million donations in the data set. 2 million donations. $500 million in donated Contains data from 2003 through 2018 Video Talk This talk mostly describes how to get the data set and index it in Elasticsearch and then visualize with the provided dashboard. Importing the Dashboard This assumes that you have already indexed the data using the scripts in the GitHub repository. See the related blog pieces for more information. Connect to the Kibana dashboard.  If you ran Elasticsearch / Kibana locally then the URL is probably: http://localhost:5601 Ve

Visualizing public data sets with Python and ElasticSearch

Image
I needed a big data set so I could learn how we could load and visualize data using Elasticsearch and Kibana. There is a sample public data and sample scripts and dashboards available in the elastic GitHub repository. The " donors choice " data set is 150MB compressed and 7-9GB when expanded and indexed into Elasticsearch. The repository is old so I updated the donors choice configuration and script files. You can find the code updated for Elasticsearch 7.8 in my GitHub: https://github.com/freemansoft/examples/tree/master/Common%20Data%20Formats 6,200,000 Records over 7 GB indexed The final Donor's Choice data set flattens into 6.2 million records. The source data is contained in 3 compressed files which are then decompressed and massaged into a flattened (de-normalized) form and loaded into ElasticSearch. That index is somewhere between 7.5GB - 9GB.  Our Kibana dashboard provides vi

Differences between ML Build and Train vs Production

Image
Machine Learning  Build and Train  and  Production Execution  often use different controls, management, and run time platforms and languages.  Model invocation and feature conversion techniques are different during the exploration, training, and production execution phases. The Machine Learning process is often referred to as Build and Train .  This is where data scientists and data analysts attempt to understand the true inputs to their decision-making process. They manually manipulate data into forms that can be fed to Machine Models for training. Those models are then analyzed for predictive behavior and the whole process repeats until a target model is created.   Production inputs (Features) must be transformed into the same form they were during Build and Train .  This means that the production system needs to run the same data transformations done during Build in Train. Production feature generation and model invocation are more rigorously created and executed t