A Chrome Plugin: IsItUp serverless service dashboard
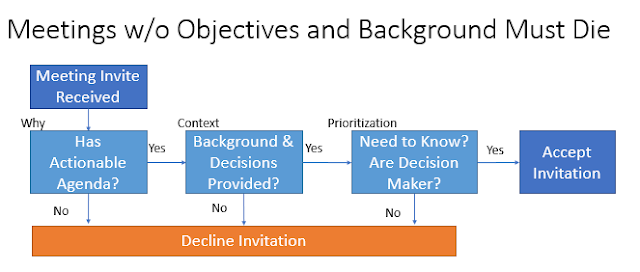
A coworker created a Chrome Extension that acts as a zero-infrastructure dashboard. It provides a simple home page that displays service health and support or documentation links related to that service. The plugin reads JSON file/text to make service calls and build the dashboard. The following picture shows 5 services across up to 6 environments. The top service does not have a Production environment. The bottom service represents a 3rd external service that has one test environment and one production environment.

The IsItUp chrome executes health checks via HTTP/HTTPS calls. The extension requires connectivity to the services being monitored.
Video created with version available Jan 21 2017
 The image to the right represents a service deployed in AWS. It shows a healthy service status along with a chrome link and an AWS console link.
 This example represents a service deployed in a development environment. The supporting icons link to swagger documentation, Jenkins, Sonar, a Confluence wiki and the GitHub repository for this service.


The IsItUp chrome executes health checks via HTTP/HTTPS calls. The extension requires connectivity to the services being monitored.
Video Walk-through
The video explains various cell examples and describes how the extension might be used. The plugin used for the video was downloaded from the Chrome Web Store .Cell Explanation
Each cell contains one Service Status plus any number of supporting links. All link icons open up a new tab to the appropriate supporting web page. It could be documentation, log aggregation, real operations consoles, dashboards or something else. The "reload" icon will refresh the service status by re-calling the service.
The image to the right represents a service deployed in AWS. It shows a healthy service status along with a chrome link and an AWS console link.This example represents a service deployed in a development environment. The supporting icons link to swagger documentation, Jenkins, Sonar, a Confluence wiki and the GitHub repository for this service.
Cells in the top row represent the fact the service doesn't exist in that environment.
Cells in the bottom row represent the same application deployed in two different cloud environments. Each contains a link to some web site plus a link to the appropriate cloud console for that environment.
Basic Configuration
IsItUp has an options panel that accepts JSON based configuration. The extension comes with the sample file used in the video and these screen shots. The sample configuration can be extracted from the Configuration Text box on the options page. The sample will change over time as new features are added or as users make suggestions.
The file has two main sections, header information and site specifications. You can find the sample JSON containing these sections on the options screen.
Header Section
The header contains a description of this dashboard in "title", row header names and column header names. The extension validates the number of row headers matches the number of rows. It also validates that the number of column headers matches the number of columns.
{
"title": "Demonstration Status",
"headers": {
"cols": "dev/ci,integration,func test,qa,prod azure,prod aws",
"rows": "Web App 1,Web App 2,Service 1,Service 2,External Service"
},
Site Specification Section
A single cell contains a "healthUrl" and zero-N "other" links and corresponding icons. This sample shows a healthUrl plus two additional links. One is a link to this Chrome extension's GIT repository. The other link is to the AWS console. This could have been to a deeper link like some CloudWatch dashboard.
{
"healthUrl": "http://headers.jsontest.com/",
"other": [
{
"url": "https://chrome.google.com/webstore/search/isitup%20naveen?hl=en",
"icon": "https://www.google.com/s2/favicons?domain=chrome.google.com"
},
{
"url": "https://aws.amazon.com/console/",
"icon": "https://www.google.com/s2/favicons?domain=aws.amazon.com"
}
]
}

Comments
Post a Comment