Enabling Microsoft Application Insights for JMX monitoring of a Spring wired Java application
Application Insights is an Azure based application performance dashboard that can monitor applications deployed inside, or outside, Azure. Application Insights SDKs are available for a variety of languages with a heavy focus on standard library web driven applications or services.
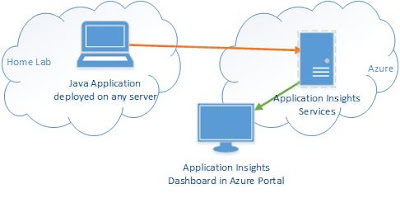 This blog entry describes how easy it is to enable Application Insights for a Spring wired Java application that does not use any of the out-of-the-box supported web hooks. In this case, we are enabling Java / JMX monitoring of a custom Spring application running in my home lab. Performance information is gathered by Application Insights where it is displayed in the Azure Portal.
I did this work as part of building a message driven application that had no true web interface. The application runs in a container that does not support tomcat or web filters normally used to enable Application Insight.
Microsoft does a good job of describing how to monitor Java Tomcat, Struts, Spring MVC and other standard web applications on their web site.
 Log into your Azure portal and create a new Java web application instance of Application Insights. My application isn't a true java web application but "Other" is experimental so I went with it. As of 2015 Dec 20, all Application Insights instances seem to be in Central US.

Find the Insights instance key. This key binds your application to this instance/dashboard.
Do Not check this key into any public repository or expose this key. It can be used by any application to push events to your dashboard. Azure Application Insights is a metered service so messages cost you money in a non-development environment
Make sure to add the ApplicationInsights jar files to your project dependencies. The previously mentioned Microsoft Azure blog article describes how to do this.
 Create a TelemetryConfiguration instance using Spring to call TelemetryConfiguration.getActive(). This will force the loading of the ApplicationInsights.xml configuration file that you put in src/main/resources.
... ...
 This sample xml config file sends basic JVM statistics to the Applications Insight instance bound by the included key. This configuration gathers information about the number of loaded classes, the amount of heap memory used and the number of threads in this VM.
Microsoft examples show how to monitor heap and cpu. Any exposed JMX monitors can be added. The following example adds an active thread count monitor.
You can use the JVisualVM MBean inspector to find other information that can be added to your ApplicationInsights dashboard.
...
...
WARNING: Some JMX beans include double quotes in their paths, names or attirbutes. Elements with quotes in their name must be surrounded by escaped quotes to the name value. This in the config file by wrapping with with "

 JMX beans show up in the Application Insights dashboard as custom metrics. Add new graphs for those metrics or re-task the existing graphs to display your JMX information. The image to the right shows where JMX information appears as Custom metrics in the configuration screen.

I did this work as part of building a message driven application that had no true web interface. The application runs in a container that does not support tomcat or web filters normally used to enable Application Insight.
Microsoft does a good job of describing how to monitor Java Tomcat, Struts, Spring MVC and other standard web applications on their web site.
Steps
- Create an Application Insights instance
- Enable Application Insights in a Java application, binding the application and dashboard with a shared Instrumentation Key
- Create a Spring Bean that enables Application Insights for a non-MVC/non-Struts application.
- Create an ApplicationInsights.xml file that adds monitors for standard Java VM statistics exposed via JMX.
- Run the Application
- Configure the Application Insights instance dashboard to show the enabled Telemetry and metrics.
Create an Application Insights instance.
Step 1 is to create an Application Insights instance Use this Microsoft Azure blog article, Getting Started with Application Insights in a Java web project, to create an Application Insights instance for your new application. Application Insights gathers metrics/telemetry information from applications based on a set of monitors. You can use the same Application Instance instance for any number of components if you manage the names of the monitors to be unique across the application components. I am monitoring a single application for the purposes of this exercise.
 Log into your Azure portal and create a new Java web application instance of Application Insights. My application isn't a true java web application but "Other" is experimental so I went with it. As of 2015 Dec 20, all Application Insights instances seem to be in Central US.
Find the Insights instance key. This key binds your application to this instance/dashboard.
Do Not check this key into any public repository or expose this key. It can be used by any application to push events to your dashboard. Azure Application Insights is a metered service so messages cost you money in a non-development environment
Enable JVM metrics in a Spring Application
We are going to enable ApplicationInsights metrics for a standalone Spring MVC application or one that runs in a semi-custom platform like the Mule ESB which has its own filter/web configuration. This assumes that you are not able to enable monitoring through the web filter or other methods described in the Microsoft documentation. The Application Insights team documentation describes how to monitor web applications running with a variety of containers and frameworks.
Make sure to add the ApplicationInsights jar files to your project dependencies. The previously mentioned Microsoft Azure blog article describes how to do this.
Add a Telemetry Configuration Spring bean
 Create a TelemetryConfiguration instance using Spring to call TelemetryConfiguration.getActive(). This will force the loading of the ApplicationInsights.xml configuration file that you put in src/main/resources.
... ...
Create an ApplicationInsights.xml file
 This sample xml config file sends basic JVM statistics to the Applications Insight instance bound by the included key. This configuration gathers information about the number of loaded classes, the amount of heap memory used and the number of threads in this VM.
Microsoft examples show how to monitor heap and cpu. Any exposed JMX monitors can be added. The following example adds an active thread count monitor.
You can use the JVisualVM MBean inspector to find other information that can be added to your ApplicationInsights dashboard.
WARNING: Some JMX beans include double quotes in their paths, names or attirbutes. Elements with quotes in their name must be surrounded by escaped quotes to the name value. This in the config file by wrapping with with "
Run the Application.
The previous configuration enables debug output for testing. You should see trace data like the following show up in your logs if trace logging is enabled
AI: TRACE 21-12-2015 07:52, 17: Metric JMX: Heap Memory Usage-used, 4.2598904E7

AI: TRACE 21-12-2015 07:52, 17: Metric JMX: Loaded Class Count, 8150.0

AI: TRACE 21-12-2015 07:52, 17: Metric JMX: Thread Count, 53.0

AI: TRACE 21-12-2015 07:52, 17: Sent performance counter for 'Processor % Processor Time'(Processor, % Processor Time, _Total): '3.7053394317626953'<

AI: TRACE 21-12-2015 07:52, 17: Sent performance counter for 'Process IO Data Bytes/sec'(Process, IO Data Bytes/sec, javaw): '20.875185012817383'

AI: TRACE 21-12-2015 07:52, 17: Sent performance counter for 'Memory Available Bytes'(Memory, Available Bytes, ): '9.881853952E9'

AI: TRACE 21-12-2015 07:52, 17: Performance Counter: Process Private Bytes: 1.14066984E8

AI: TRACE 21-12-2015 07:52, 17: Performance Counter: Process % Processor Time: 0.06347814202308655
Configure the Dashboard
 JMX beans show up in the Application Insights dashboard as custom metrics. Add new graphs for those metrics or re-task the existing graphs to display your JMX information. The image to the right shows where JMX information appears as Custom metrics in the configuration screen.
You can pick the metrics in each graph by selecting the graph and then selecting the metrics you want for that graph in the Chart Details section to the right of the graph.
More in the future
This article is already pretty long. I'll show how to add the metrics to the insights dashboard in a future posting. This blog was driven by a desire to add Application Insights monitoring to a Mule ESB application.
2015 12 21 Created
2015 12 23 Added Escaped values and bean hierarchy GC example
2015 12 21 Created
2015 12 23 Added Escaped values and bean hierarchy GC example


Comments
Post a Comment