Posts

Showing posts with the label Metrics

Baked-in Runtime Falure Identification and Remediation

Image
Web and other API-based applications are made up of some set of services, data stores and compute dependencies or partner business systems. We need some way of continually monitoring the components in isolation and in situ so that we can have automation repair or heal certain types of problems. Different control plane components have different requirements for the components that they manage. This means the instrumentation may be subtly different, shallower, or more detailed in order for the different control planes to take action for their particular needs.  Health checks are one technique for determining the current health of a component. They are in-service test endpoints or very specific external code that exercise some capability of a specific instance of a component service.  Each control plane or remediation touchpoint needs to be examined to understand what their actual area of concern is. This is refined into a set of health checks. Then the problems that can be ident...
Querying Python Transactions and Spans as dependencies in Azure Application Insights with OpenCensus

Image
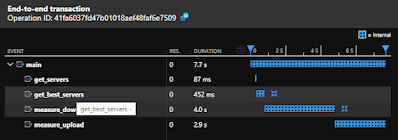
Azure Application Insights is my go-to Observability platform when I want it to "just work". Application Insights can be a collection point for custom and third-party library Python Tracing and Transaction data. You can easily send Python Open Census span data from anywhere in the world into Azure Application Insights. You see your program transaction details from any browser that can reach the Azure console.  OpenCensus  spans are captured in  Application Insights  as  dependencies . The  OpenCensus Azure Exporter  supports nested spans letting you capture and measure nested operations. Every captured span is stored as a row in the Application Insights dependencies table.  The chart to the right was created from this sample code that has one main span and 4 nested sub-spans From FreemanSoft SpeedTest project https://github.com/freemansoft/speedtest-app-insights Executio...

What do we want out of load or performance test?

Image
We use performance tests to verify the raw throughput of some subsystems and to verify the overall impact some subsystem has on an entire ecosystem.  Load tests act as documentation for performance indicators and re-enforce performance expectations. They are vital in identifying performance regression. Load and performance tests are an often overlooked part of the software release lifecycle.  Load tests, at their most basic level, are about stress testing a system by dropping a lot of work onto it. Sometimes it is a percentage of expected load, other times it is the expected load, and other times it is future expected levels of load.  A failure to test  expected  near-term load can lead to spectacular public failures. Video Measurements  Your  business requirements  determine requirements for throughput, latency. Your  financial requirements impact the cho...

Monitor Internet Broadband service with a Raspberry Pi 4 and some Python

Image
You can easily automate capturing broadband connection statistics with some Python code  running on a Raspberry Pi, a Mac or, a PC.  I used a Raspberry Pi 4 as my test appliance because it is cheap and can support 1GB/s ethernet connections. That means it is fast enough to service most residential or low-end commercial connections. I'm lazy and wanted the data to end up in a secure public cloud that could be populated and viewed from anywhere.  We can send our broadband statistics from 1 or more locations and graph the different locations against each other. Any tool could be used. Monitoring One or Compare Two  We wanted to compare two different internet provider's service levels.  One provider is a FIOS 1GB down / 1GB up.  The other is a cable service with 1GB down / 50MB up. The providers and the technology were different.  We wanted to know if the complaints about one of the providers were valid. Relies on Speedtest.net infrastructure We're going t...

Querying Python logs Azure Application Insight

Image
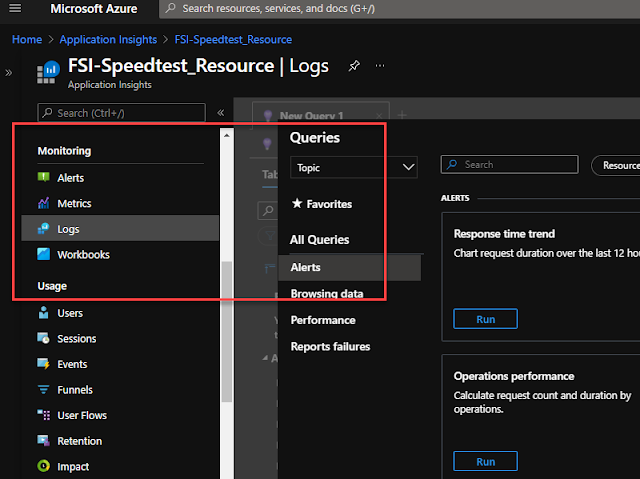
You can send your Python logs to Azure Application Insights from anywhere and then leverage the Application Insights query and dashboard capabilities to do log analysis.  Getting access to the logs is trivial. I wanted to plot basic internet performance information from data generated from two different machines in two different locations.  The source code is on GitHub here  freemansoft/speedtest-app-insights . That project runs speedtest.net measurements and then posts them to Azure Application Insights.  It logs the raw data when the --verbose switch is set.  That verbose output is sent to Azure App Insights. Execution pre-requisites You have an Azure login You have created an Azure Application Insights Application key https://docs.microsoft.com/en-us/azure/azure-monitor/app/create-new-resource You have pushed data to Application Insights.  I used https://github.com/freemansoft/speedtest-app-insights with the _--verbose__ switch Video walkthrou...

Querying Python Metrics as customMetrics and custom attributes as customDimensions in Azure Application Insight

Image
Azure Application Insights can be a collection point for Python Metrics that you can query and filter against.  We can send Open Census metrics from anywhere in the world into Azure Application Insights. This lets us see our program metrics from any browser that can reach the Azure console.  Application Monitor gives us a zero admin performance console. OpenCensus metrics are recorded in Application Insights as customMetrics . Every metric sent is a row in Application Insights. The Azure  OpenCensus Azure Exporter  adds a standard set of attributes that appear in App Insights as CustomDimensions .  We can add additional custom dimensions (attributes) to any metrics record sent Azure Application Insights. All metrics are actually captured in a customMetrics table that we can query against. Execution pre-requisites You have an Azure login You have created an Azure Application Insights Application ...

Displaying Python Metrics in Azure Application Insights

Image
We can capture Python performance metrics in Azure Application Insights. This will let us see our program performance from anywhere that can reach the Azure console.  I've used this to capture a variety of Python data manipulation and process timing without having to stand up any metrics databases or dashboards. I wanted to plot basic internet performance information from data generated from two different machines in two different locations.  The source code is on GitHub here freemansoft/speedtest-app-insights . That project runs speedtest.net measurements and then posts them to Azure Application Insights.  We can create charts for any of the data gathered as part of this process. Target Graphic We want to create a graphical tile that shows our connection ping time broken out per test machine. The program code above posts new ping time data every 5 minutes.  This graphic shows the ping results for the last 4 hours. Execution pre-requisites You have an Azure login You...

Enabling Microsoft Application Insights for Mule ESB monitoring

Image
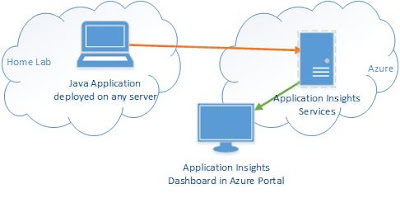
Microsoft Azure Application Insights requires Mule 3.7 or later. Application Insights depends on org.apache httpclient and httpcore versions that are first bundled with Mule 3.7 Application Insights is an Azure based application performance dashboard that can monitor applications deployed inside, or outside, Azure.  Application Insights SDKs are available for a variety of languages with a heavy focus on standard library web driven applications or services. This blog entry describes how easy it is to enable Application Insights for a Mule ESB application that does not use any of the out-of-the-box supported web hooks. In this case, we monitoring the out-of-the-box JMX beans provided by Mule. Performance information is gathered by Application Insights where it is displayed in the Azure Portal. Mule exposes performance data about applications and flows via JMX.  Any of this can be forwarded to the Application Insights Dashboard. Steps Create an Application Insights...