Enabling Microsoft Application Insights for Mule ESB monitoring
Microsoft Azure Application Insights requires Mule 3.7 or later. Application Insights depends on org.apache httpclient and httpcore versions that are first bundled with Mule 3.7
Application Insights is an Azure based application performance dashboard that can monitor applications deployed inside, or outside, Azure. Application Insights SDKs are available for a variety of languages with a heavy focus on standard library web driven applications or services.
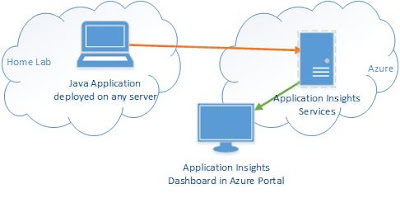 This blog entry describes how easy it is to enable Application Insights for a Mule ESB application that does not use any of the out-of-the-box supported web hooks. In this case, we monitoring the out-of-the-box JMX beans provided by Mule. Performance information is gathered by Application Insights where it is displayed in the Azure Portal.
Mule exposes performance data about applications and flows via JMX. Any of this can be forwarded to the Application Insights Dashboard.

This target bean is nested two deep in the hierarchy. This makes for slightly complicated naming conventions in the JMX configuration.
Mule.muleappinsightexample:type=Flow,name=exampleflow
 We will monitor the Average Processing Time , Max Processing Time and number of Processed Events for a the flow in this single flow application.
...
...

The mule corresponding Mule XML contains ApplicationInsights bootstrap Spring Configuration and the flow itself. It looks like:

 Charts can be created for any custom metric. Just create a chart and then bind one or more Custom metric to the chart by selecting them in the chart details.
Each custom metric, can be added to the Application Insights dashboard. This image shows the three Mule Flow JMX values exposed by this example program.
2015 12 23 Created
Application Insights is an Azure based application performance dashboard that can monitor applications deployed inside, or outside, Azure. Application Insights SDKs are available for a variety of languages with a heavy focus on standard library web driven applications or services.

Mule exposes performance data about applications and flows via JMX. Any of this can be forwarded to the Application Insights Dashboard.
Steps
- Create an Application Insights in Azure
- Enable Application Insights in mule application.
- Bind the Mule application and Application Insights with a shared Instrumentation Key
- Select the Mule JMX data to be displayed in the ApplicationInsights dashboard.
- Configure the Mule applicaton to send Mule JMX data to Application Insights
- Run the Application
- Configure the Application Insights instance dashboard to show the enabled Telemetry and metrics.
Create an Application Insights instance in Azure
Create an Azure Application Insights instance as described in this previous blog
Enable Application Insights
Create a Spring bean that loads the Telemetry Configuration. Put this Spring Bean in one of your xml configuration files. Instructions can be found in this previous blog.
Bind a Mule application to Application Insights
Create an ApplicationInsights.xml file and add the InstrumentKey found in the Azure dashboard. Instructions can be found in this previous blog You can find an example ApplicationInsights.xml file below
Select Mule application data to send to Application Insights
Determine which JMX beans you wish to expose to Application Insights and add those to our configuration.
Use a JMX inspection tool to see information available in a Mule application. We will JVisualVM in this example. These screen shots are based on the example application below.
- Run JVisualVM from a command prompt
- Add the MBean Plugin and restart jvisualvm. This has to be done only once.
- Select your running application in the left pane.

- Select the MBeans tab at the top of the right hand pane.
- Select Mule.<appname> in the right tab. This will show you the various Application and Flow level metrics that are available. This example app only has one flow so flow and application statistics will mostly be identical.


This target bean is nested two deep in the hierarchy. This makes for slightly complicated naming conventions in the JMX configuration.
Mule.muleappinsightexample:type=Flow,name=exampleflow
 We will monitor the Average Processing Time , Max Processing Time and number of Processed Events for a the flow in this single flow application.
- ObjectName: Mule.muleappinsightexample:type=Flow,name=muleappinsightexampleflow
- .Attribute: AverageProcessingTime
- Average: Should stay within operation ranges.
- ObjectName: Mule.muleappinsightexample:type=Flow,name=muleappinsightexampleflow
- Attribute: MaxProcessingTime
- Raw number: grows without bounds over times
- ObjectName: Mule.muleappinsightexample:type=Flow,name=muleappinsightexampleflow
- Attribute: ProcessedEvents
- Raw number: grows without bounds over times
Configure Mule to send Mule application data
Add the monitors to the mule application ApplicationInsights.xml file. This example monitors basic flow data.
Sample Application Flow

This example was written against a very simple Mule HTTP echo type application.
The mule corresponding Mule XML contains ApplicationInsights bootstrap Spring Configuration and the flow itself. It looks like:
...
...
WARNING: Mule flow name JMX beans include double quotes. This means you must add escaped quotes to the name value. This is done by wrapping the flow name with "
WARNING: Mule flow name JMX beans include double quotes. This means you must add escaped quotes to the name value. This is done by wrapping the flow name with "
Monitors in Application Insights
 Charts can be created for any custom metric. Just create a chart and then bind one or more Custom metric to the chart by selecting them in the chart details.
Each custom metric, can be added to the Application Insights dashboard. This image shows the three Mule Flow JMX values exposed by this example program.
2015 12 23 Created


Comments
Post a Comment