Visualizing the Donors Choose data set with Kibana and Elasticsearch
The Elasticsearch example codebase includes a Donors Choose public data set. The example uses a set of Kibana visualizations. The following image shows a subset of the visualizations used in the dashboard.
Donors Choose Kibana Dashboard
- The map visualization uses provided geopoint , Lat and Long, data.
- You can see there are
- 6.2 million donations in the data set.
- 2 million donations.
- $500 million in donated
- Contains data from 2003 through 2018

Video Talk
This talk mostly describes how to get the data set and index it in
Elasticsearch and then visualize with the provided dashboard.
Importing the Dashboard
This assumes that you have already indexed the data using the scripts in the
GitHub repository. See the related blog pieces for more information.
Connect to the Kibana dashboard. If you ran Elasticsearch / Kibana locally then the URL is probably:
| |
Verify the index exists. You can explore the fields by clicking on donorschoose | |
Visualizations bind to index patterns. Create an index pattern using the new index. | |
First specify the pattern value you will use to bind to the index | |
Specify the field to be used for the time series. All Elasticsearch data is time series data. | |
You should be presented with the fields that make up the donorschoose index pattern fields | |
The index pattern donorschoose should now appear in the Saved Objects list | |
Now we are going to load the saved dashboard configuration. Load donorschoose_dashboard.ndjson from the git repository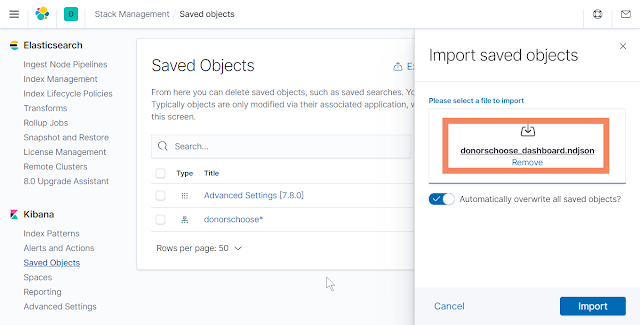 | |
The Index Pattern Identifier will have changed so we need to tell the loaded items that they are bound to the index pattern we created above. Make sure you do this for any/all that are pointed out in the right side panel. Select donorschoose for any index pattern binding requests. | |
The dashboard consists of a Dashboard parent and 30+ visualizations. Find and click on the Dashboard parent to launch a connection to the dashboard. |
Tha's all folks. You should now see a visualization similar to the one at the top of the blog. Set the date range to start in 2003.


Comments
Post a Comment