Capture Confluent Kafka Metrics easily with Jolokia , Telegraf, InfluxDB and Grafana (JTIG)
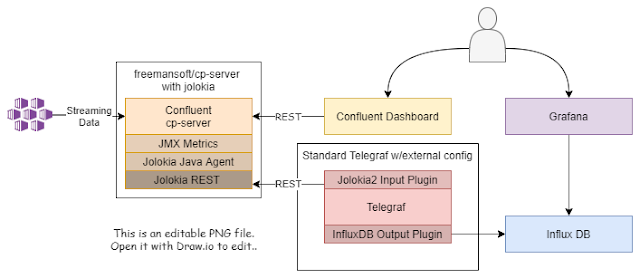
Kafka provides all kinds of metrics that can be used for operational support and tuning work. We can use Telegraf/Jolokia to capture metrics from the various Confluent broker nodes and put those metrics into an Influx DB. We can then create Grafana dashboards for those metrics using Grafana
 |
| Deployed Components |
- We run a custom Kafka Broker Docker Image built on top of the confluent/cp-server image.
- That image just adds the Jolokia JVM Agent jar file.
- Run a docker-compose.yml to start Kafka that enables Jolokia as a Java Agent
- The agent URL for demontration purposes
- The Telegraf standalone agent conf enables the Jolokia2 input adapter.
- The configuration file can be built into a new image or the configuration file can be mounted inside the standard DockerHub Telegraph image.
- Telegraf runs with this new configuration file.
- Telegraf retrieves the data from the Jolokia REST endpoints and sends it to InfluxDB
- Grafana provides visualization. It uses InfluxDB as a data source.
Jolokia Java Agent runs on each Kafka Broker Node
The off the shelf Confluence cp-server image doesn't include the necessary Jolokia Java Agent. You can build your own image or get one off of Docker Hub to play with.
Run everything in Docker
You can build your own Docker image using the commands in the GitHub repository. It contains code and configuration to run a full Kafka cluster and a monitoring cluster that includes Telegraf, InfluxDB, and Grafana. The Readme.md can walk you through the steps.
confluent/cp-server w/Jolokia on Docker Hub
I've pushed a pre-build Docker Image to Docker Hub. You can find a pre-built cp-server/jolokia Docker image on Docker Hub under freemansoft/cp-server. The Image is built on top of the supported Confluence 5.5.1 image at the time of this writing


Comments
Post a Comment