Querying Python logs Azure Application Insight
You can send your Python logs to Azure Application Insights from anywhere and then leverage the Application Insights query and dashboard capabilities to do log analysis. Getting access to the logs is trivial.
I wanted to plot basic internet performance information from data generated from two different machines in two different locations. The source code is on GitHub here freemansoft/speedtest-app-insights. That project runs speedtest.net measurements and then posts them to Azure Application Insights. It logs the raw data when the --verbose switch is set. That verbose output is sent to Azure App Insights.
Execution pre-requisites
- You have an Azure login
- You have created an Azure Application Insights Application key https://docs.microsoft.com/en-us/azure/azure-monitor/app/create-new-resource
- You have pushed data to Application Insights. I used https://github.com/freemansoft/speedtest-app-insights with the _--verbose__ switch
Video walkthrough
Data Capture Notes
Our test program generates a single log message that is sent to Azure. We can see these messages in the Logs section as individual events. They appear as _traces_ which is the _OpenCensus_ naming convention and does not represent a true _Tracing event_. Metrics, Tracing, and Logs are all captured in the form of individual events in the Logs section of Application Insights. This is in addition to any other view on the same data.
Querying Metrics in the Application Insights Logs
- Log in to the Azure portal
- Open up the Application Insights resource that contains your data
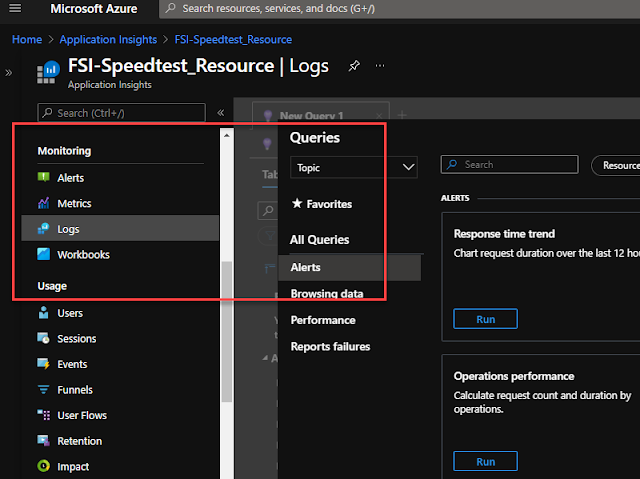
- Scroll down the left-hand side until you find Monitoring / Logs
- You will get a New Query 1 panel with a pop-up panel on top of it that tries to give you useful web service queries.
- Close the popup. You should see something like the right side of this
- Type traces in the query window.
- Delete any extra characters. You can run more sophisticated queries later
- Click on the blue Run Query button
- You will see logging events in the results panel.
References
Python Metrics and logs in Azure Applications Insights- https://joe.blog.freemansoft.com/2022/11/querying-python-transactions-and-spans.html
- https://joe.blog.freemansoft.com/2021/03/querying-python-logs-azure-application.html
- https://joe.blog.freemansoft.com/2021/03/querying-python-metrics-custom-tags-as.html
- https://joe.blog.freemansoft.com/2021/03/displaying-python-metrics-in-azure.html
- https://joe.blog.freemansoft.com/2021/03/monitor-internet-broadband-service-with.html
Microsoft Guides- https://docs.microsoft.com/en-us/azure/azure-monitor/app/opencensus-python
- https://docs.microsoft.com/en-us/azure/azure-monitor/app/create-new-resource
- https://github.com/census-instrumentation/opencensus-python/tree/master/contrib/opencensus-ext-azure
Python Data generator - https://github.com/freemansoft/speedtest-app-insights
Created 3/2021
- https://joe.blog.freemansoft.com/2022/11/querying-python-transactions-and-spans.html
- https://joe.blog.freemansoft.com/2021/03/querying-python-logs-azure-application.html
- https://joe.blog.freemansoft.com/2021/03/querying-python-metrics-custom-tags-as.html
- https://joe.blog.freemansoft.com/2021/03/displaying-python-metrics-in-azure.html
- https://joe.blog.freemansoft.com/2021/03/monitor-internet-broadband-service-with.html
- https://docs.microsoft.com/en-us/azure/azure-monitor/app/opencensus-python
- https://docs.microsoft.com/en-us/azure/azure-monitor/app/create-new-resource
- https://github.com/census-instrumentation/opencensus-python/tree/master/contrib/opencensus-ext-azure
- https://github.com/freemansoft/speedtest-app-insights


Comments
Post a Comment