Recording Java Metrics with the Windows Performance Counters
Example Java Code
Library Performance
Library and Source Code
Classspath
CreatingCountersWindowsOperatingSystem
Repository Organization
Related Posts
Java provides good monitoring through the MBean interface and monitoring tooling. It is nice because it works the same no matter what platform you run on. There are times when you want to plug into the native performance recording tools especially when running on Windows machines because this makes it easy to integrate your Java application with your Windows based operational consoles.
A Java test program generates 2,000,000 performance counter events per second in a single thread and up to 6,500,000 updates per second multi-threaded. (source available on github) This means that counter updates can be made at normal volumes with very little effect on the system.
 I've created a simple C# library and Java / JNI wrapper that lets you record native Microsoft Windows Performance Counters directly from your Java code. Those events can then be viewed with perfmon.exe or other Microsoft Windows tools. You can also view performance counters on remote machines using perfmon.exe.
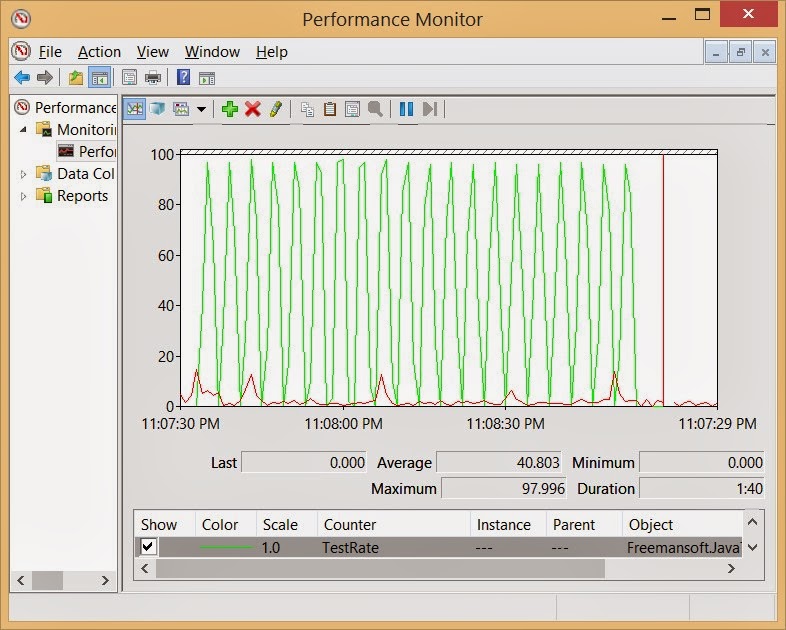
The graph on the right shows how the rate operations per second counter behaves when feed a square wave of traffic: 200 messages per second for 2 seconds followed by 0 messages per second for 2 second. The counter averages the rate/second across time resulting in a saw tooth pattern.
...
This table describes the library's maximum performance as measured using a circa 2011 I7 Macbook Pro. The test programs are in the source tree on GitHub. The C# library has two public interfaces.
It should work for most folks building the examples because of the relative path to the libraries.
Library Performance
Library and Source Code
Classspath
CreatingCountersWindowsOperatingSystem
Repository Organization
Related Posts
Java provides good monitoring through the MBean interface and monitoring tooling. It is nice because it works the same no matter what platform you run on. There are times when you want to plug into the native performance recording tools especially when running on Windows machines because this makes it easy to integrate your Java application with your Windows based operational consoles.
A Java test program generates 2,000,000 performance counter events per second in a single thread and up to 6,500,000 updates per second multi-threaded. (source available on github) This means that counter updates can be made at normal volumes with very little effect on the system.
 I've created a simple C# library and Java / JNI wrapper that lets you record native Microsoft Windows Performance Counters directly from your Java code. Those events can then be viewed with perfmon.exe or other Microsoft Windows tools. You can also view performance counters on remote machines using perfmon.exe.
The graph on the right shows how the rate operations per second counter behaves when feed a square wave of traffic: 200 messages per second for 2 seconds followed by 0 messages per second for 2 second. The counter averages the rate/second across time resulting in a saw tooth pattern.
Example Java Code
The previous perfmon.exe image was built by the following code that calls the increment() functions on a single counter at regular intervals.
- The first portion initializes the bridge.
- The second registers the category/counter combination to obtain a key.
- The final section updates the counter in a loop.
Library Performance
This table describes the library's maximum performance as measured using a circa 2011 I7 Macbook Pro. The test programs are in the source tree on GitHub. The C# library has two public interfaces.
- WindowsPerformanceLiason is an instance method based interface that uses string Category, Instance and Counter keys in the same way the underlying calls to the windows system do. This approach suffers from continual string mapping and copying as strings are passed across the Java / C# boundary.
- WindowsPerformanceFacade is a static class wrapper accepts integer keys representing a Category, Instance and Counter. Callers first requests an integer key using those three strings and then uses the integer key from then on. The previous example code demonstrates use of this interface.
The JNI code was generated with JNI4Net. Initial performance was pretty disappointing both from a maximum Counters / Second and from CPU usage point of view. I found what I think is a small problem with the JNI4Net support library. I wrote a small powershell script that massages the generated C# JNI code to get the "Patched JNI4Net" numbers you see below.
| Threads | C# Library | Instance Methods String Keys Default JNI4Net | Instance Methods String Keys Patched JNI4Net | Static Methods Integer Counter Key Default JNI4Net | Static Methods Integer Counter Key Patched JNI4Net |
|---|---|---|---|---|---|
| 1 | 3,600,000 | 14,000 | 270,000 | 14,000 | 2,000,000 |
| 2 | 6,400,000 | 26,000 | 500,000 | 26,000 | 3,500,000 |
| 3 | 9,300,000 | 40,000 | 700,000 | 40,000 | 5,300,000 |
| 4 | 10,700,000 | 46,000 | 960,000 | 46,000 | 6,500,000 |
| 6 | 11,300,000 | 47,500 | 900,000 | 47,500 | 6,300,000 |
| 8 | 12,500,000 | 48,000 | 48,000 |
Library and Source Code
You can find the library on GitHub https://github.com/freemansoft/java-to-windows-performance-counters C# source, Java test program source, powershell build and counter configuration scripts and pre-built binaries available on GitHub. Pre-built dll and jar files are located in the Packages directory.
Most java clients will use the WindowsPerformanceCounterFacade class in green. It totally encapsulates the functionality for updating Windows Performance Counters from a Java prog
Most java clients will use the WindowsPerformanceCounterFacade class in green. It totally encapsulates the functionality for updating Windows Performance Counters from a Java prog
Classpath
Your program's classpath needs to include the WindowsPerformanceCounter jar file, the jni4net jar file and the directory where the two dlls are on the file system. Here is my Eclipse .classpath file when working with the examples.It should work for most folks building the examples because of the relative path to the libraries.
Creating Counters in the Windows Operating System
You must create the counters with using an account with Administrator privilge. Powershell scripts are the simplest way to do this. You can find a powershell script in the java directory on Github. A sample can also be found in an earlier blog article. You can create as many counters as you wish in a single Powershell script. Compound or "bonded" counters must be created as sequential counters with the primary counter first and the base counter second.
Repository Organization
-- This section is incomplete --
Related Posts
The table was built using Tabulizer as popularized by the slightly garish Blogger Sentral.


This comment has been removed by a blog administrator.
ReplyDeleteThis comment has been removed by a blog administrator.
ReplyDeleteThis comment has been removed by a blog administrator.
ReplyDeleteThis comment has been removed by a blog administrator.
ReplyDeleteFraps Converter which is I often use is good product because of its specific things. In Farps converter, it is a kind of video format conversion to another fast and convenient. In fact, it's free don't hurt, either. Even is without any advertising, pop-up window or watermark. the original source
ReplyDelete