Failure Modes Effects Analysis - FMEA - Step One - throwing down failures.
We can make it better if we measure or analyze it. Let's analyze a small program to determine where it might fail and what we can do about it.
We will break down a software program into smaller modules and look at how each phase or component might fail. We will also look for silent failures or a lack of success metrics where something didn't occur at a time when there should have been some activity.
Sample System Under Analysis
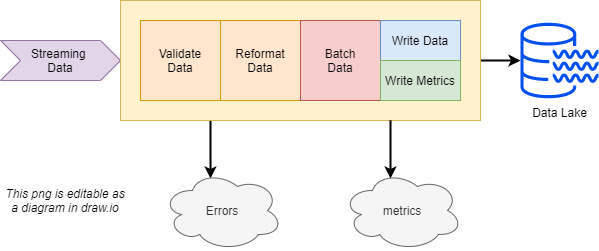
Our example system is a data lake sink that
- Reads streaming data
- Validates the data
- Bundles the data into micro-batch sets
- Writes the data to a data lake.
- Each lake write has a corresponding metrics push that updates our metrics store, statistics and other features.
Video Walkthrough
In this video, we throw down as many failures as we can think of. We can worry about detection and remediation in a later phase
Worksheet Template
We will record the identified failure modes using a worksheet like this one.
| Component | Fault | Severity | Likely | Detection | Remediation | Tech or Business |
|---|---|---|---|---|---|---|
- Component: A subsystem or module we can tie the possible failure to
- Fault: A specific failure. We define these as specifically as possible.
- Detection: This describes how we would detect this problem. It could be automated or manual as part of some regular process. The worst situation is if your detection method is angry customers calling us.
- Remediation: A manual or automated process that can be used to fix the problem or park the problem for later work
- Severity: The risk/damage that occurs with this type of failure
- Likelihood: A proxy for the frequency of this problem.
Severity and Likelihood are used to prioritize the order for creating remediation processes.
Streaming Sink Worksheet
Faults were identified during our 10-minute session. The analysis moved from left to right through the components in the diagram.
We primarily went after the Faults in this section. We took half-hearted attempts at Remediation and detection.
You can see a couple of Ingestion lines in the middle of the sheet. That is because we discovered a couple of additional ingestion problems while looking at something else. We can always re-order the fault list. Don't stop to be orderly in the first pass. Just capture everything that comes to mind.
Missing functionality
Identified missing modules
We identified that the diagram above is missing a metrics collection box at the beginning of the flow. We want to capture metrics around the number of messages received to match up against the metrics bound to the data lake writer.
Related
Blog Articles
- Throwing down failures http://joe.blog.freemansoft.com/2021/01/failure-mode-analysis-ste-one-throwing.html
- Detection and remediation https://joe.blog.freemansoft.com/2021/02/failure-mode-analysis-step-two.html
- Step 1: Throwing down failures https://youtu.be/RdmfSiqsXAs
- Step 2: Detection and Remediation https://youtu.be/98puya9szWc
- Garage Door Failure to Close https://youtu.be/qFDbRTnvYxs
Vide
Created 2021/01/31
Title Updated 2024/03


Comments
Post a Comment