UiFlow Python turns an M5Stack into an Azure App Insights Dashboard
I wanted to build an IoT dashboard that auto-populates from query Azure Application Insights and displays the query results. UIFlow, Circuit Python, and Micro Python all let you create low-code programs on IoT devices. I used M5Stack's UiFlow as a low-code Python generator. The program runs an Azure query via REST API and displays the results on the built-in M5 Core display. The query can be manually triggered or run automatically on a timer without me writing any code.

https://flow.m5stack.com/
This flow is available on This .m5f example on GitHub.
Video Walkthrough
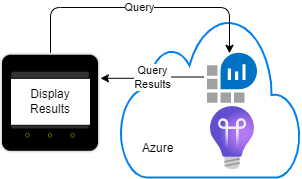
Device Topology
Our IoT device, the M5Stack Core 2, runs an API query against Application
Insights. The search results are returned as JSON.
 The Device Display

UiFlow lets us lay different fields and labels onto the LCD panel via drag and
drop. We can set the name of the component for later access.
UiFlow/Python has pre-built blocks that let me replace the text in any of
those labels/fields or draw lines and take other activities.
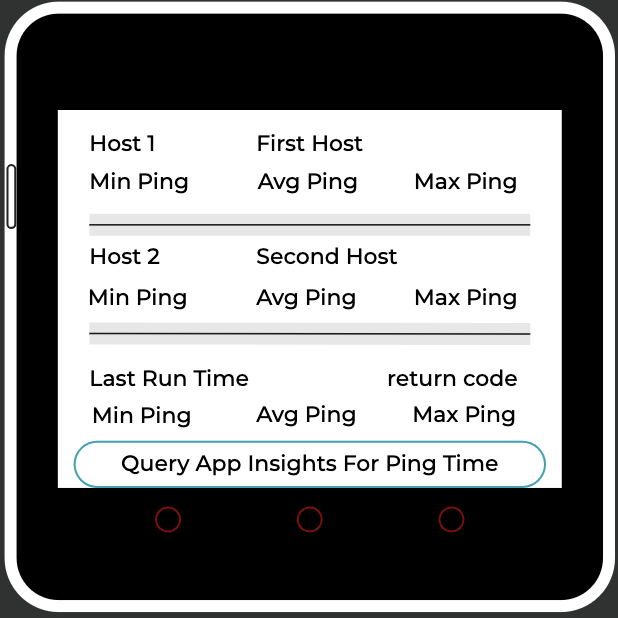
This screen shows the ping statistics for two different hosts. There are
three numbers, min, average, and max. The oval at the bottom is a
touch-enabled button that refreshes the data.
 M5 UIFlow Python Layout
You can find UiFlow on the M5Stack website at https://flow.m5stack.com/ .
The left-hand side of UiFlow will show an image of the screen of the specific
device you are using. Think of it as the mobile phone designer version
of the layout tools that let you see your UI on different screen sizes.
Each of the fields and buttons is a separate, named, component. UiFlow
Python contains libraries that let you change the text for any of these
labels. All of these fields were dragged, drag-and-drop, into place and
then edited.
Device Setup
The setup configures the wifi and builds the URL containing the query that
will be sent to Azure Application Insights. The query looks back a
specific time span from "now" so the query does not need to be changed for
each run. Note that the URL includes
- The Application Insights endpoint
- The Application Insights instance ID for our App Insights
- An escaped query string as a query parameter in the Microsoft query language
Setup creates a periodic timer that triggers a refresh every 15 minutes and
then makes a remote call to get data to initialize the display.
The Instance ID should be considered a secret and not checked into source
code repositories.

 Re-Use with Functions

A display refresh can be initiated in 4 different ways. We put all the
refresh code in a function. The refresh code queries the remote site and
populates the display.
Our code refers to the function in the 4 different places a request can
be initiated. This is demo code so no parameters were passed and no
values are returned.
- On Startup
- Every 15 minutes on the timer
- When the touch-sensitive area that looks like a big button is pressed.
- When the middle button just below the screen is pressed.
Run Query, Parse JSON results and Update Display
This function is the meat of the program. It makes the request, parses the results, and then updates the display. Note that this function changes the color of the LEDs to match the current step and the result state.- Make a GET call to the Azure App Insights web endpoint using the URL created in Setup and add an Authentication token header with the name X-Api-Key
- If the call is successful then process it. The returned data is a nested map and list structure.
- Update the run time on the display
- Update the HTTP result code field.
- Convert the response body into a JSON structure
- Extract the result rows from the JSON.
- Display the first row's results in the first host's area if there is a first-row containing data.
- Display the second row's results in the 2nd host's area on the display if there is a 2nd row of data.
The definition also includes a rudimentary failure handler in the case an
HTTPS call to Azure fails for whatever reason.

Pay special attention to the list and map operations
where we extract the data from the JSON structures. They exactly match the
nested structure. Note that this is a low-code programmer design tool
so there are some surprises like the way lists start with the "1st" element.
Application Insights Metrics Query Results.
All Application Insights are returned in JSON as a list of tables. Our
query only returns a single set of data so there is a single table in the
results. Our application
- Extracts the first table. This will be a Python Map
- We don't use the columns section because we have already built the screen layout in UiFlow.
- Extract the rows from the map. This will be a list of rows.
- Populate the display with the values in the first row of the rows array: host, min, avg, max.
- Populate the display with the values in the second row of the rows array: host, min, avg, max.
Sample Application Insights Query Result.
{
"tables": [
{
"columns": [
{
"name": "cloud_RoleInstance",
"type": "string"
},
{
"name": "min_value",
"type": "real"
},
{
"name": "avg_value",
"type": "real"
},
{
"name": "max_value",
"type": "real"
}
],
"rows": [
[
"pi-18d8aec7",
41.922,
559.1242,
601146.3
],
[
"pi-153a3987b",
5.557,
6.763047,
8.683
]
],
"name": "PrimaryResult"
}
]
}
Look at the screens above to see where the data is placed.
 Updating all Host Fields with result row data

I was lazy and hard-coded to functions that each populate a section of the
screen layout above. One function populates the top host block and the
other the 2nd host block in the middle of the page. Note that these
return silently if there is no first or second host data.
Serial Port Output
This is the output generated by the print statements
https://api.applicationinsights.io/v1/apps/SCRUBBED-INSTANCE-ID/query?
query=customMetrics+%7C+where+name+%3D%3D+"ST+Ping+Time"+%7C+where+timestamp+>+ago(4h)+%7C+summarize+min(value)%2C+avg(value)%2C+max(value)+by+cloud_RoleInstance
Query: customMetrics+%7C+where+name+%3D%3D+"ST+Ping+Time"+%7C+where+timestamp+>+ago(4h)+%7C+summarize+min(value)%2C+avg(value)%2C+max(value)+by+cloud_RoleInstance
RTC time: 2022-11-30 20:25:00 Wed
Response: {'tables': [
{
'columns': [
{'name': 'cloud_RoleInstance', 'type': 'string'},
{'name': 'min_value', 'type': 'real'},
{'name': 'avg_value', 'type': 'real'},
{'name': 'max_value', 'type': 'real'}],
'rows': [
['pi-18d8aec7', 62.668, 453.9218, 1852.822],
['pi-153a3987b', 5.831, 13.82269, 22.972]],
'name': 'PrimaryResult'
}]}
Response Cols: [
{'name': 'cloud_RoleInstance', 'type': 'string'},
{'name': 'min_value', 'type': 'real'},
{'name': 'avg_value', 'type': 'real'},
{'name': 'max_value', 'type': 'real'}]
Response Rows: [['pi-18d8aec7', 62.668, 453.9218, 1852.822], ['pi-153a3987b', 5.831, 13.82269, 22.972]]
Host 1 Results: ['pi-18d8aec7', 62.668, 453.9218, 1852.822]
Host 2 Results: ['pi-153a3987b', 5.831, 13.82269, 22.972]
Source Code
The source code shown here is not yet available on GitHub
Revision History
Created 2022 11


Comments
Post a Comment